W3WProtect: Kernel ETW and Velociraptor
I’ve found that logging is always one of the hardest parts of any tool, and this is only amplified once you event Kernel space. With Security products, you need a way to have your logs easily ingestible and readable, otherwise analysts/admins are not going to check them and they’ll go unread. Unread notifications may result in a compromise going undetected.
The added problem with Kernel Space is that you need the events to be quick. You can’t just write to a file on disk, because it’s slow and you’ll be adding a bottle neck onto your operating system. We only have limited stack space within kernel as well, so we need to keep our code as precise and condensed as possible. Trying to write our own logging format is just not going to be efficient.
Recently, I’ve taken a strong appeal to moving my tools over to ETW. It’s relatively easy to implement and allows us to be super flexible when handling events, with the added benefit of logs not needing to hit disk. ETW allows subscribers to stream the events in any way that suits them, and it’s supported by multiple languages.
This is where Velociraptor comes in. I’ve been using Velociraptor a whole bunch recently, and one of its great features is that it allows for network wide collection of ETW events.
This blog will cover:
What is ETW,
How to write a Kernel Provider,
How to use Velociraptor to collect events and centralise them.
What is ETW?
Event Tracing for Windows provides an easy Kernel or Application level logging similar to EVTX. The major difference is that ETW logs are not generated by default, and require a subscriber before they will start logging.
ETW works in three parts:
Providers: Creates the events,
Controllers: Manages Event Tracing Sessions which subscribe to Providers,
Consumers: Consumes the events from an Event Tracing Session.
Event Tracing Sessions can either be logged to a trace log (.etl) or directly consumed by an application.

Windows 10 has over 1000 providers built-in by default, and for the most part they go unutilized. This is a huge shame because they can be a great source of evidence when dealing with an active intrusion, especially with some of the Kernel Logging on processes, modules, registry and file modifications. I might go into detail in another blog on how I use native ETW providers to monitor systems within Velociraptor.
In this situation, Velociraptor is our consumer. We’ll use it to setup an Event Tracing Session, then get all of the results set back to our Velociraptor server. This will give us a centralized location for storing our W3WProtect logs for all of the web servers in an environment.
Kernel ETW Providers
As mentioned above, I’ve really been loving utilizing ETW as my default logging solution in my projects. Surprisingly, this was probably the easiest part of the W3WProtect project. While the documentation was a few decades out of date, it was pleasantly simple to implement.
There’s actually very little code required for an ETW provider, and instead we’re required to write a manifest file which contains all the relevant information for our events.
And wow, did I learn how much I hate xml.
If you want to see the full W3WProtect manifest, it’s located here.
The initial step is setting up the Provider.
When generating a GUID, I just use PowerShell’s “New-Guid”.
Message/Resource File Names point to where the W3WProtect driver should be located.
<provider name="W3WProtect"
	guid="{c4b1b7f8-0093-4c96-9444-3eca5bb6174e}"
	messageFileName="%SystemDrive%\Windows\w3wprotect.sys"
	resourceFileName="%SystemDrive%\Windows\w3wprotect.sys"
	symbol="W3WProtect"
	message="$(string.Name)"
>
After Provider, there are only two attributes worth mentioning: Events and Templates
‘Event’ is where we describe the different event IDs we want to create.
We can provide all the standard fields you come to expect with event logs:
value (ID),
Level,
Message.
You can see template is also referenced, describing what additional fields our event will have.
<event
	value="1001"
	symbol="ProcessCreationBlock_Enforced"
	version="1"
	task="Enforce"
	level="win:Warning"

	message="$(string.ProcessCreationBlocked.Enforced)"
	template="tid_Process_Block"
	channel="w3wprotect"
/>
Templates provide the structure for our events by defining what additional information we will provide when the event is called.
We can provide an inType and outType (optional) to declare the variable types, as well as the names of the fields.
When we import this manifest into our code later, we’ll be able to call functions that represent these templates.
<template tid="tid_Process_Block">
	<data
		inType="win:UInt32"
		name="ProcessId"/>
	<data
		inType="win:UnicodeString"
		name="ProcessName"/>
	<data
		inType="win:UInt32"
		name="ParentProcessId"/>
	<data
		inType="win:UnicodeString"
		name="CommandLine"/>
</template>
Turning a Manifest into Code
The Official Microsoft Guide to add Kernel ETW providers will be more detailed than me, but essentially we need to add our xml manifest as a recourse to our project. Once added we need to change the item type to MessageCompile:
Right Click -> Properties -> General -> ItemType -> MessageCompile
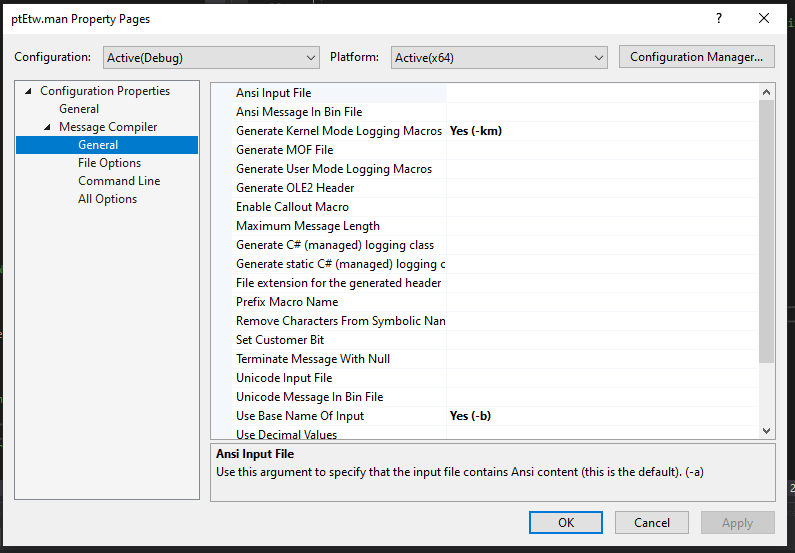
There’s a few other important settings, but the main one is setting “Generate Kernel Mode Logging Macros” to “Yes”. This way when our header file is generated, we’ll be able to import and call the generated Macros. Now when you compile your project, the header file for the manifest will be generated.
#include "ptEtw.h"
...
// Register the provider
// within the DriverEntry
EventRegisterW3WProtect();
...
// Unload the provider during
// the unload function.
EventUnregisterW3WProtect();
Before we can start sending events, there’s three small parts that we need to include:
Include our now ETW header.
Register the provider during our Driver Entry. (Make sure you do it before anything that could call a function)
Unregister the provider when our driver unloads. We don’t want any kernel leaks!
After that, we’re ready to start logging!
Once we’ve setup our Provider, we can create our events through the imported functions. Most of the W3WProtect functionality will have a check to see if we’re in Passive or Enforced mode before creating an event log. This mostly just changes the message from “W3WProtect Blocked” to “W3WProtect would have blocked”.
if (!Globals.Enforced)
{
	EventWriteProcessCreationBlock_Passive(
		NULL,
		HandleToULong(ProcessId),
		procName,
		HandleToULong(CreateInfo->ParentProcessId),
		commandLine
	);
	goto Cleanup;
}

CreateInfo->CreationStatus = STATUS_ACCESS_DENIED;

EventWriteProcessCreationBlock_Enforced(
	NULL,
	HandleToULong(ProcessId),
	processName->Buffer,
	HandleToULong(CreateInfo->ParentProcessId),
	commandLine
);
That’s essentially all that it takes to get Kernel ETW support enabled! Next we’ll have to get Velociraptor to start ingesting our events so we can reliably get notified on attempted exploitation!

Velociraptor is a unique, advanced open-source endpoint monitoring, digital forensic and cyber response platform.
Velociraptor Overview :: Velociraptor - Digging deeper!
Velociraptor is an open source host-based tool that allows analysts to both monitor hosts and collect forensic artifacts. Agents installed on each host allows us to remotely query the network through Flows (single host query) and Hunts (multiple host query). Velociraptors strongest feature is the Velociraptor Query Language (VQL), which allows for easy and flexible querying of hosts. I won’t be going into too much detail, but it’s essentially a Blue Teams Implant.
In this case we’re going to use Velociraptor to subscribe to W3WProtects ETW Provider. We can do this by writing a VQL artifact that subscribes to our provider.
This essentially ends up being one line of VQL!
Note: If you haven’t used VR before, it’s worth noting that:
- A “Client” artifact is a query that executes on a client with a defined end. E.g. Collect this file.
- A “Client_Event” artifact does not have a defined end, it will continue to stream data back to the server until you stop it.

Going through the code, we have a few key points:
Parameters: Allows us to customize what GUID we provide for W3WProtect.
Precondition: W3WProtect and ETW are Windows only, so let’s make sure we don’t try and run this on Linux!
watch_etw: This plugin subscribes to our provider and streams all the events back to the server.
watch_etw-name: The name parameter allows us to change the name of the Event Tracing Session, allowing for a little bit of OpSec.
Running this artifact on my test machines give us events like the one in the image below. You can then use VQL to better format your events, or setup a server artifact to alert you when a new event is written. The data can also be outputted as JSON or CSV, so if you’d like to centralise your logs elsewhere, you can easily do that.

Conclusion
Event logs are important! Especially when you’re monitoring for Web Exploitation! But having a way for admins to easily collect and check logs is just as important, otherwise what’s the point?
ETW and Velociraptor provides a very powerful method for getting events out of Kernel and into a centralised location!
As mentioned above, in future weeks I will look to discuss some of the other cool things I use ETW and Velociraptor for. If you want that sooner, let me know!